Our Community
Editor’s Note: This post was originally written as a guest case study for the NTEN Blog, and we are proud to cross-post it here.
Quantitative and qualitative data are often positioned as opposing or complementary means of documenting impact.
Data reports and personal snapshots are often generated separately, then placed side-by-side with the hope that the juxtaposition of hard metrics with an emotional picture and blurb will resonate with a wide range of people. In other cases, organizations produce statistics and indicators at the exclusion of “soft” data to convey a sense of business responsibility, pressured by the demand for nonprofit accountability to mirror for-profit financial statements.
While both approaches have value for specific purposes at particular points in time, numbers and narratives can be more powerfully and seamlessly employed to capture individual nonprofit and sector-wide work and more intentionally shape strategy and collaborations.
In other words, data can tell a continuous story that is meaningful, dynamic, and actionable.
In June, Tides partnered with Rhiza on a data mapping pilot using their Insight software. While Tides had previously produced annual reports that included the usual suspects – descriptions of initiatives, programs and client portfolio, bullet-point statistics and highlights, and financials – we wanted to push our analysis further by looking at our work in greater contexts and through different lenses.
We awarded a total of $17 million in education grants in 2010. Where did those grants go? Did the funding reach the communities of greatest need? What does this mean for our work going forward, especially in terms of engaging with donors on their giving?
We were looking for a way to use our quantitative data to tell a visual story and start an ongoing and responsive narrative of our communities and our work; we wanted to answer the “so what?” and “to what ends?” questions.
After doing some research and testing out some of the data mapping tools, we started with just making basic maps of where grants were made and partners are located, from which initial story threads emerged. Most strongly, we found our work was predominantly based in metropolitan areas on the East and West coasts. Although this was not unexpected – because of well-known urban issues and philanthropic trends – layering this with other data started to illuminate interesting points of discussion and analysis.
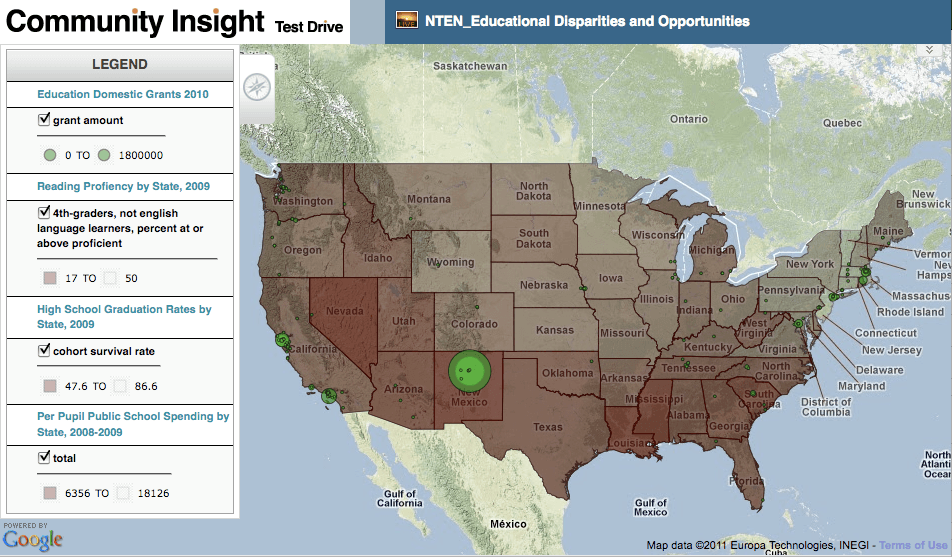
Following the case of education funding in 2010, we started to add state-by-state data about per pupil public school funding, reading proficiency, and high school graduation rates.

The larger the green circle, the greater the grant amount. The bolder the red color, the worse the state performed on the three indicators. While there are nuances behind the data to take into account – per pupil spending relative to standard of living, the loss of city-level information that show high density, underserved populations, and grantee impact beyond their office base – the layered map still clearly presents a picture and narrative of how greater funding is needed in the southern states. The state of education in the South is not a new revelation, but the fact that this map focuses specifically on how we are addressing education through funding means that our community has the ability to view the landscape and concretely plan for shifts to make impact where it is most needed.
The map, then, becomes the beginning of a story that continues with partner discussions around strategy and what the work looks like in a year, in two years, and onward. By harnessing quantitative data, our community begins a kind of qualitative “choose-your-own-adventure” story – one that empowers people to make decisions based on firmly anchored information and desired impact.
As Tides continues this work, we look to engage a broader set of individuals and institutions in the social change sector to leverage more data for greater gains and tell a grander story.
As Project Manager in the Tides Impact and Innovation department, Irene Kao develops and coordinates strategic initiatives and partnerships, fundraises, and supports business and product development. She also serves as Executive Director of Hyphen, an all-volunteer, nonprofit Asian American media organization. Prior to Tides, Irene focused on serving low-income communities – especially immigrant families – through direct services, advocacy, and administration.

Read the stories and hear the voices of social change leaders fighting for justice.